Mapping the U.S. data-center buildout over the power grid
Where AI infrastructure is landing — and the grid bottlenecks standing in the way. Built entirely from public data.
The bottleneck for AI isn't chips — it's electricity, and the years-long wait to connect to the grid. I wanted to see that collision spatially, so I pulled public datasets — EIA for power plants and transmission lines, Lawrence Berkeley National Laboratory's "Queued Up" for interconnection queues, and ERCOT's load reports — and rendered them into maps. Here's what stood out.
1. Data centers are bending a flat demand curve
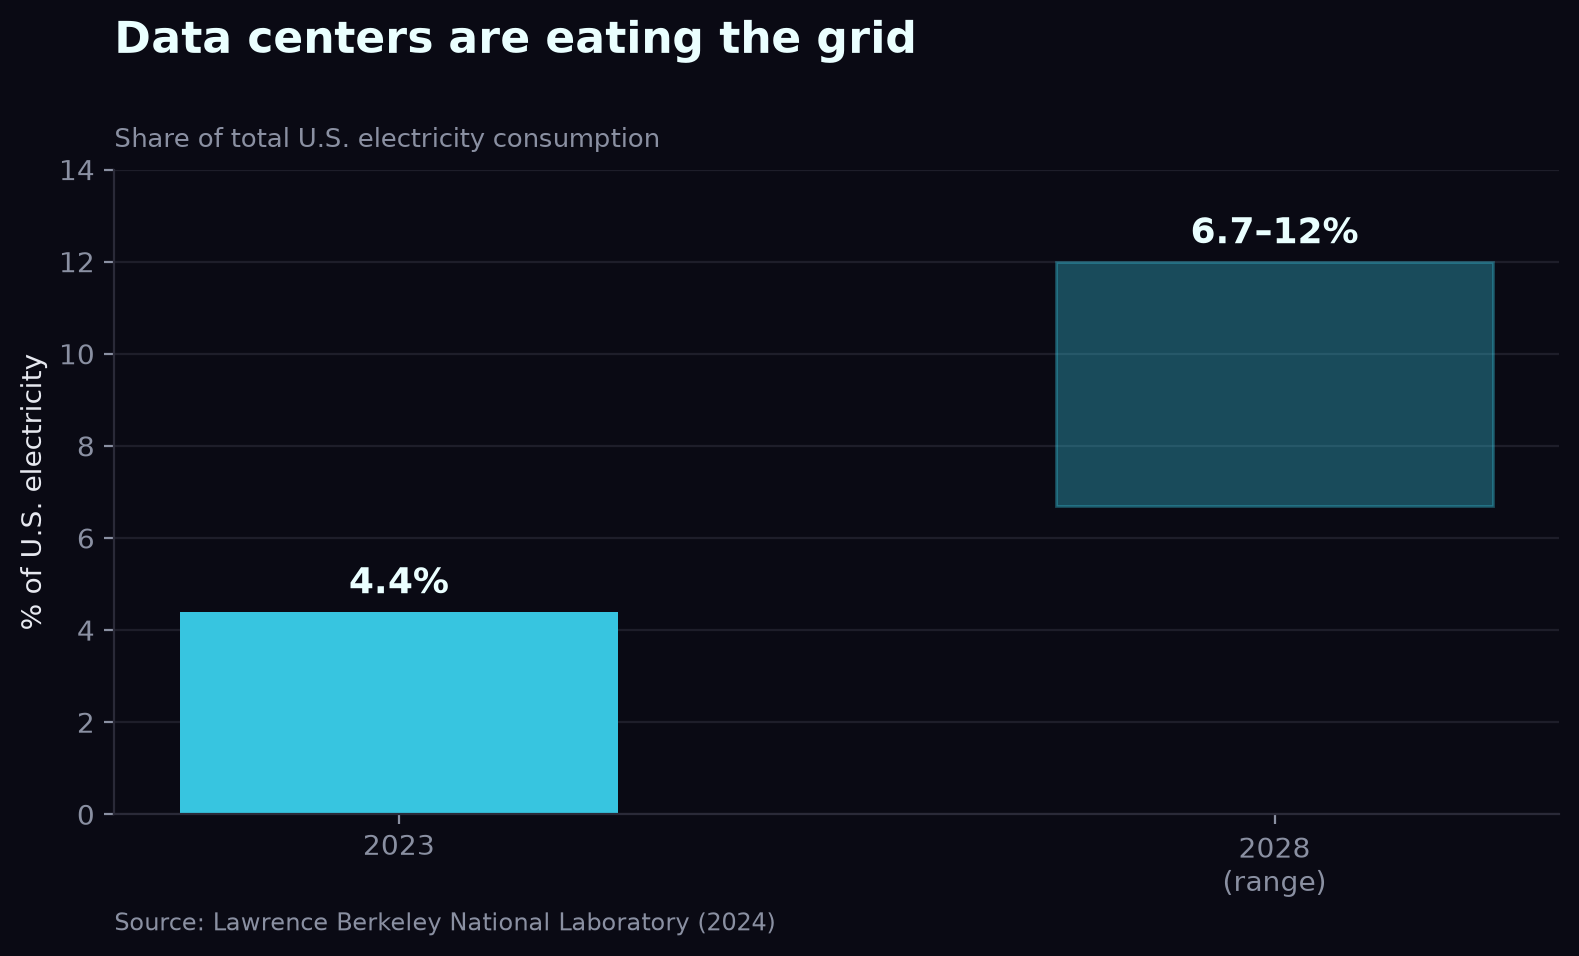
For two decades U.S. electricity demand was essentially flat — efficiency offset growth. AI broke that. Data centers consumed 4.4% of U.S. electricity in 2023, a share LBNL projects will reach 6.7%–12% by 2028. The load is also concentrated: it lands on specific grids, around the clock, faster than utilities have ever had to respond.
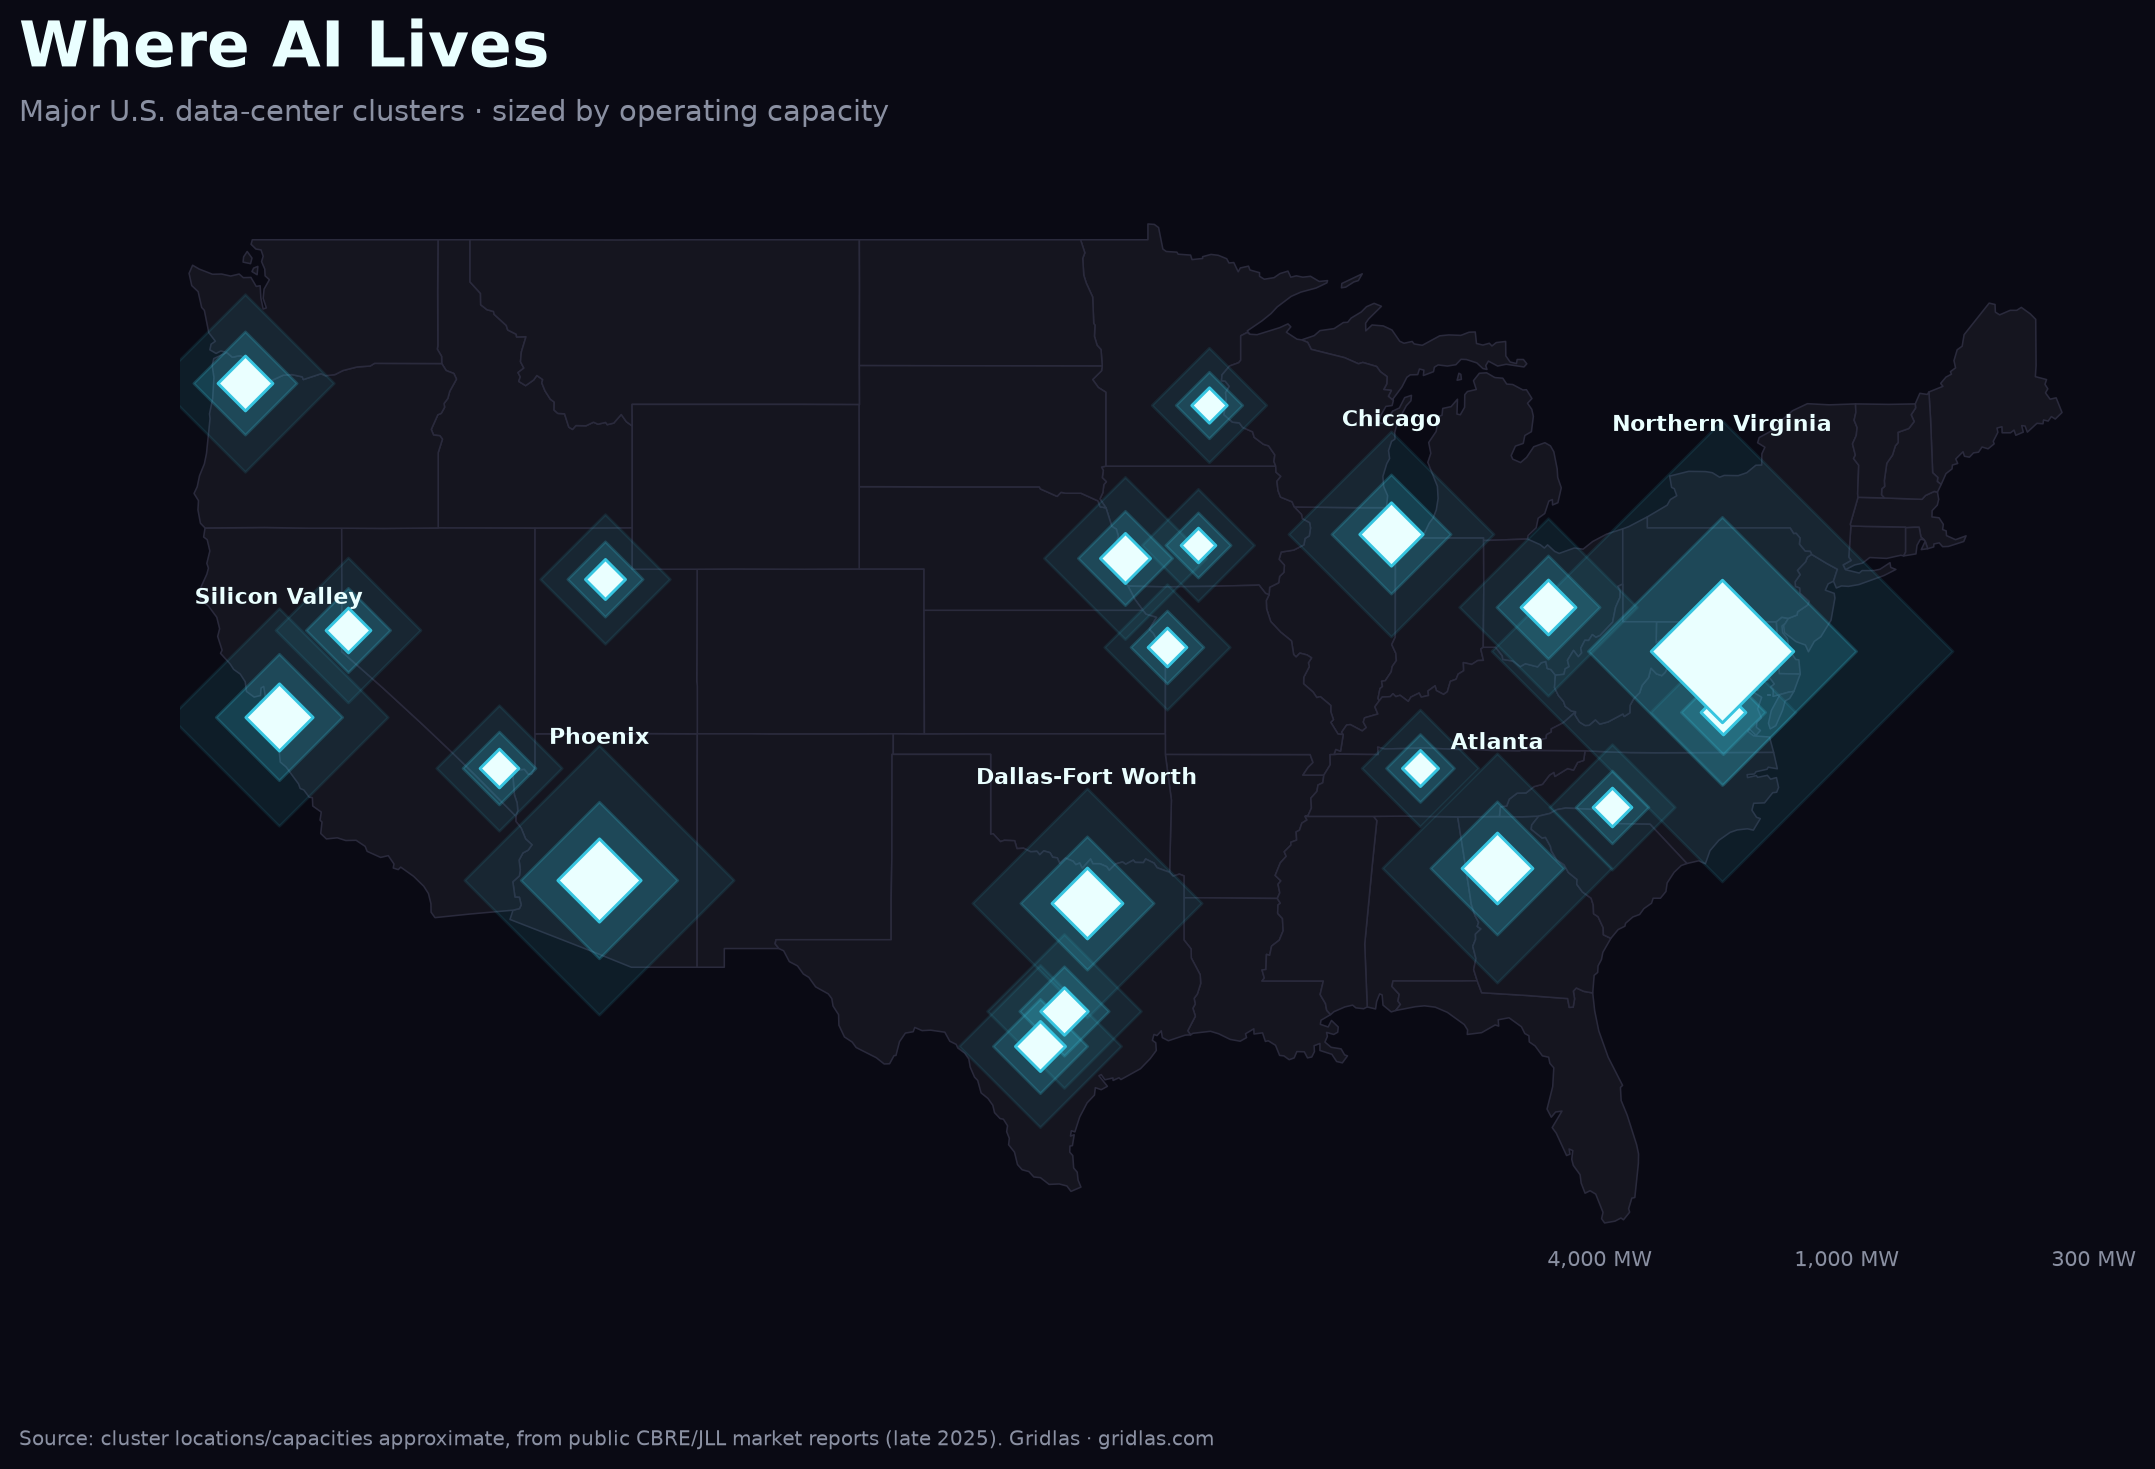
2. The map is concentrating
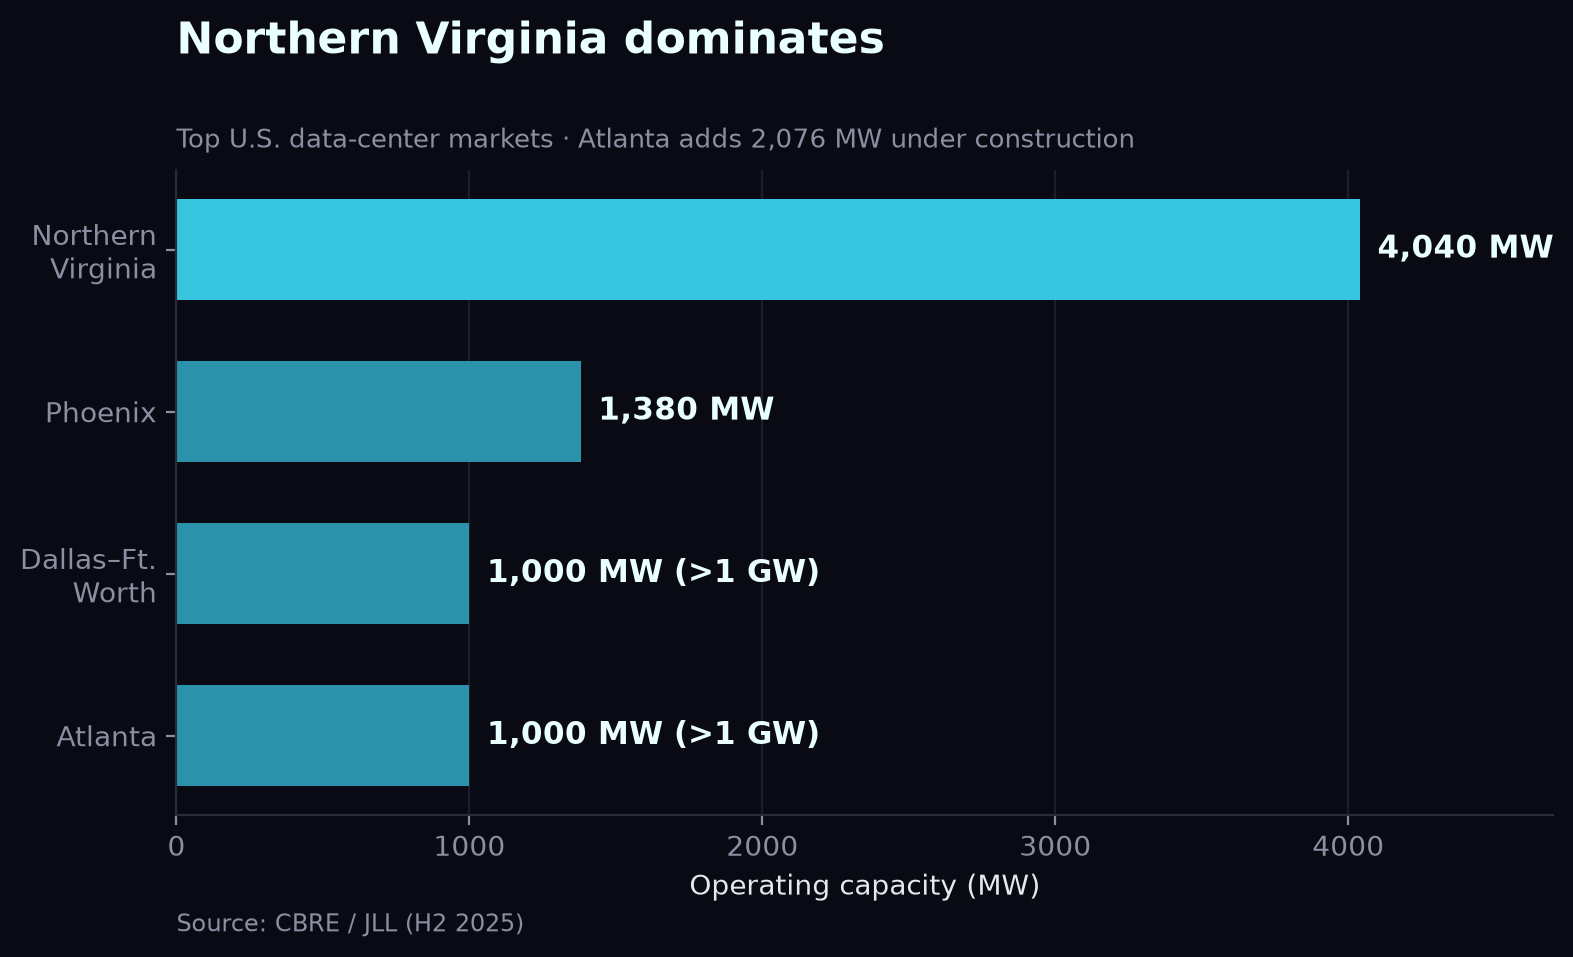
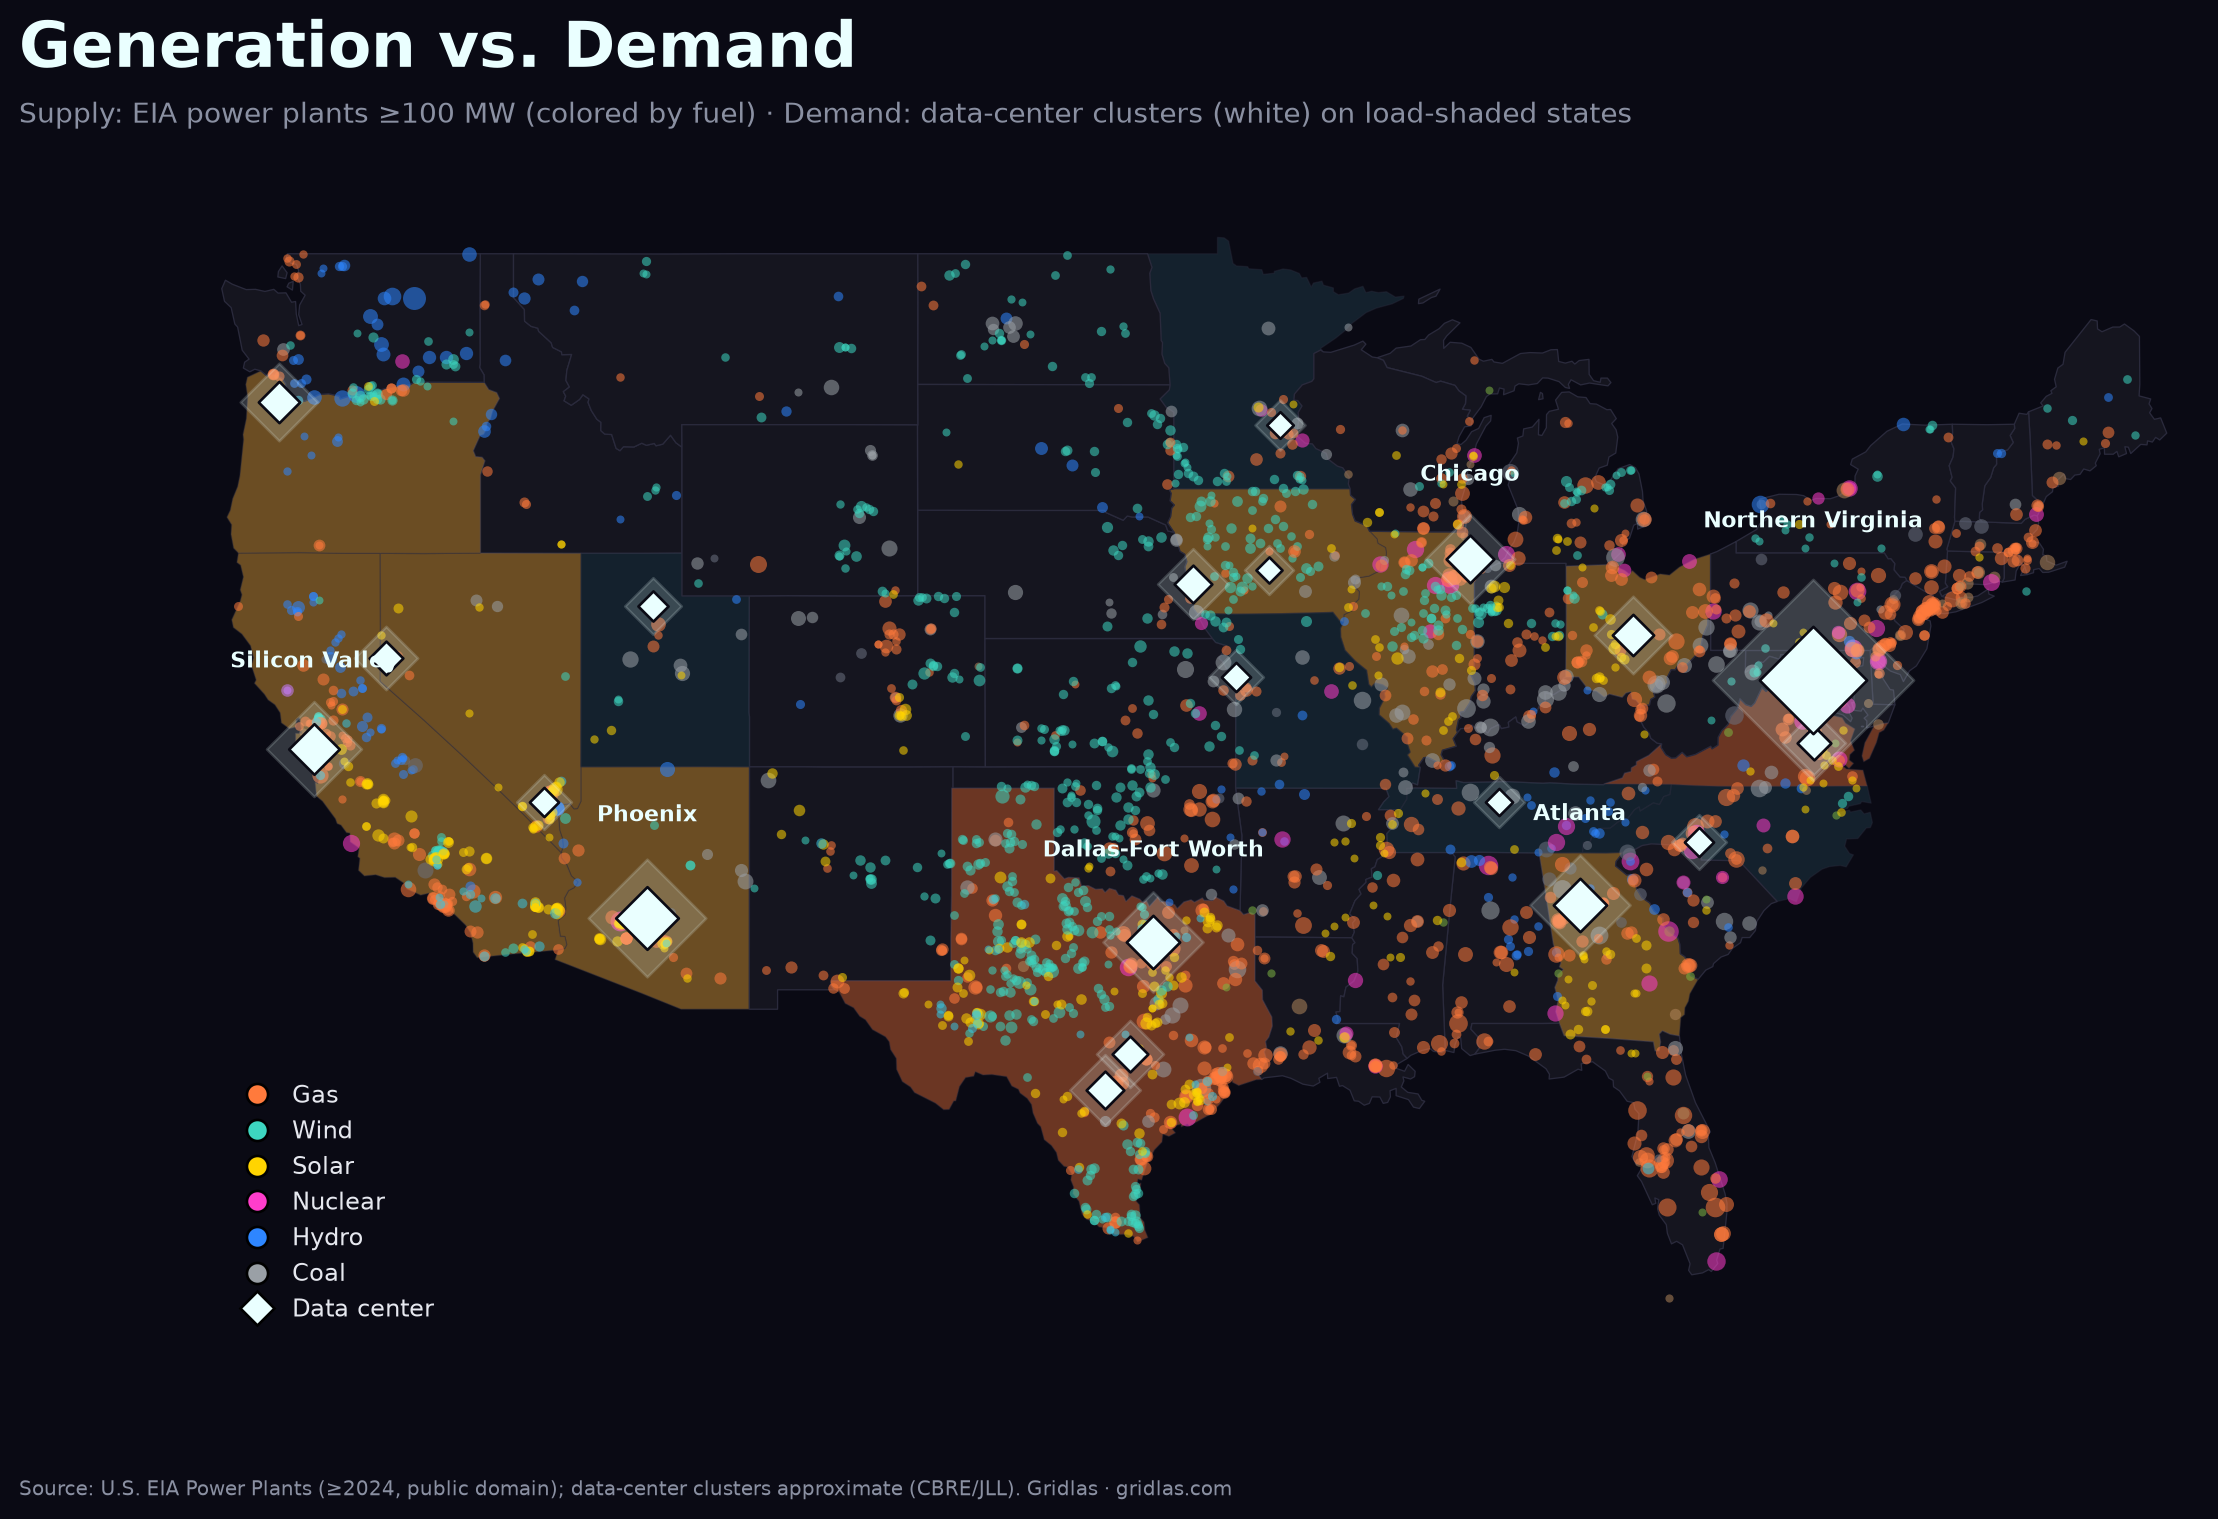
Plotting every major cluster, one market dwarfs the rest: Northern Virginia, at roughly 4,040 MW, is about 3.5× every secondary U.S. market combined. Dallas–Fort Worth and Atlanta have each crossed a gigawatt; Phoenix and central Ohio are climbing fast.
3. The real bottleneck: the interconnection queue
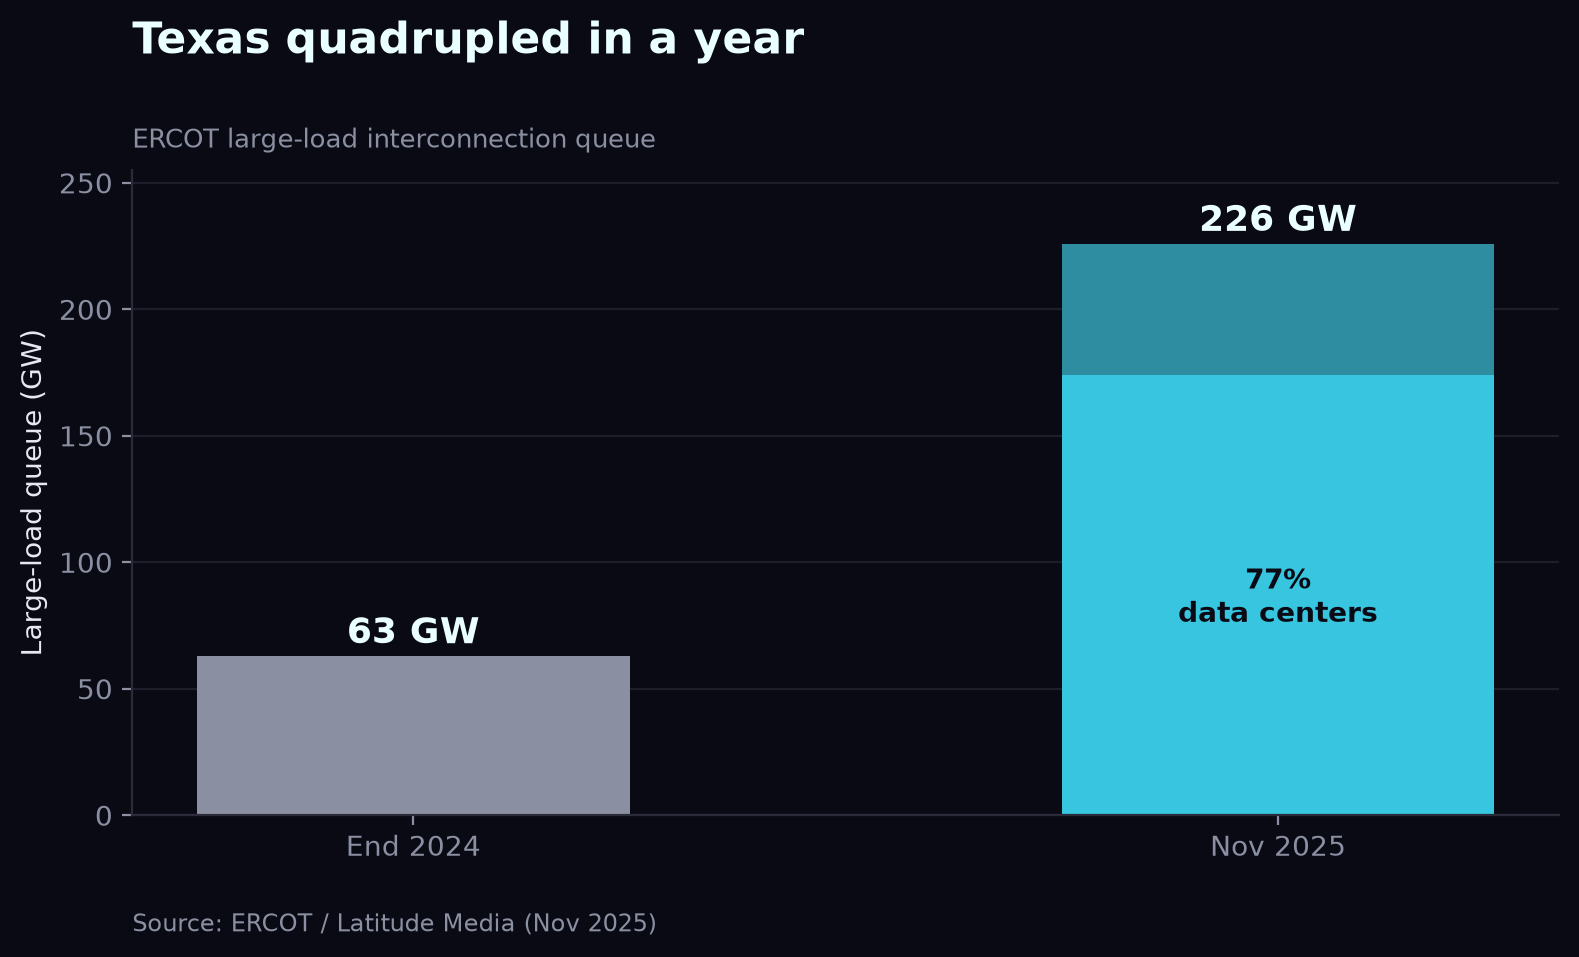
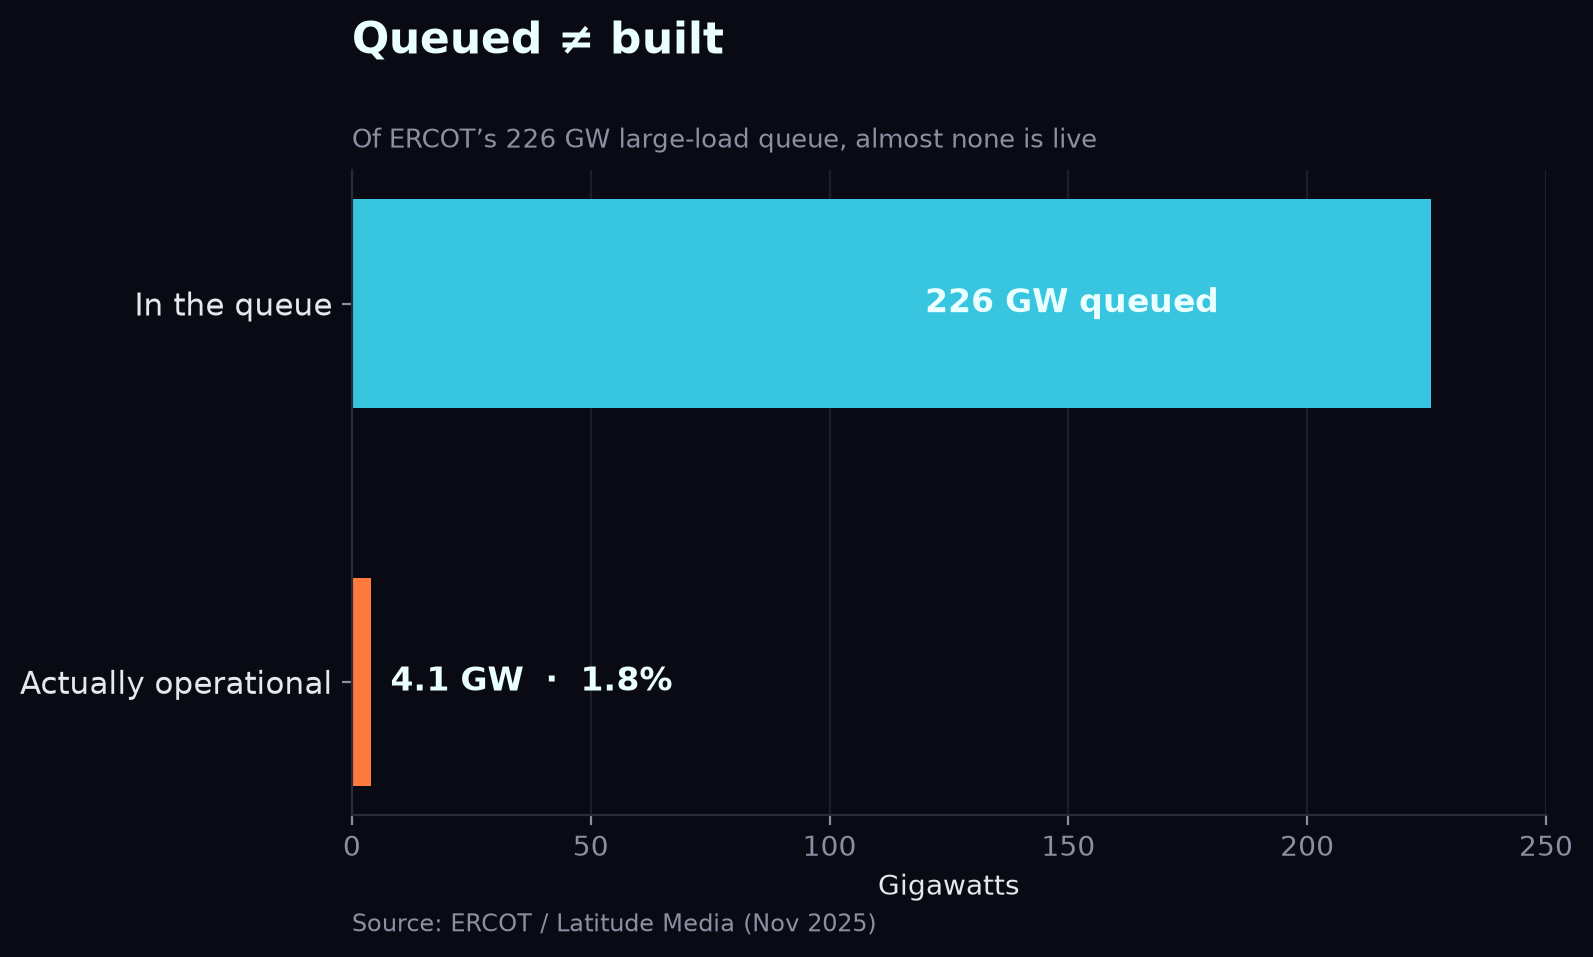
No market shows the strain like Texas. ERCOT's large-load interconnection queue went from 63 GW at the end of 2024 to ~226 GW by November 2025 — roughly a 4× jump in a year, with about 77% of it data centers aiming to connect by 2030.
But a queue is a wish list, not a build plan. Of that 226 GW, only about 1.8% is actually operational and drawing power — more than half hasn't even submitted enough information to begin review.
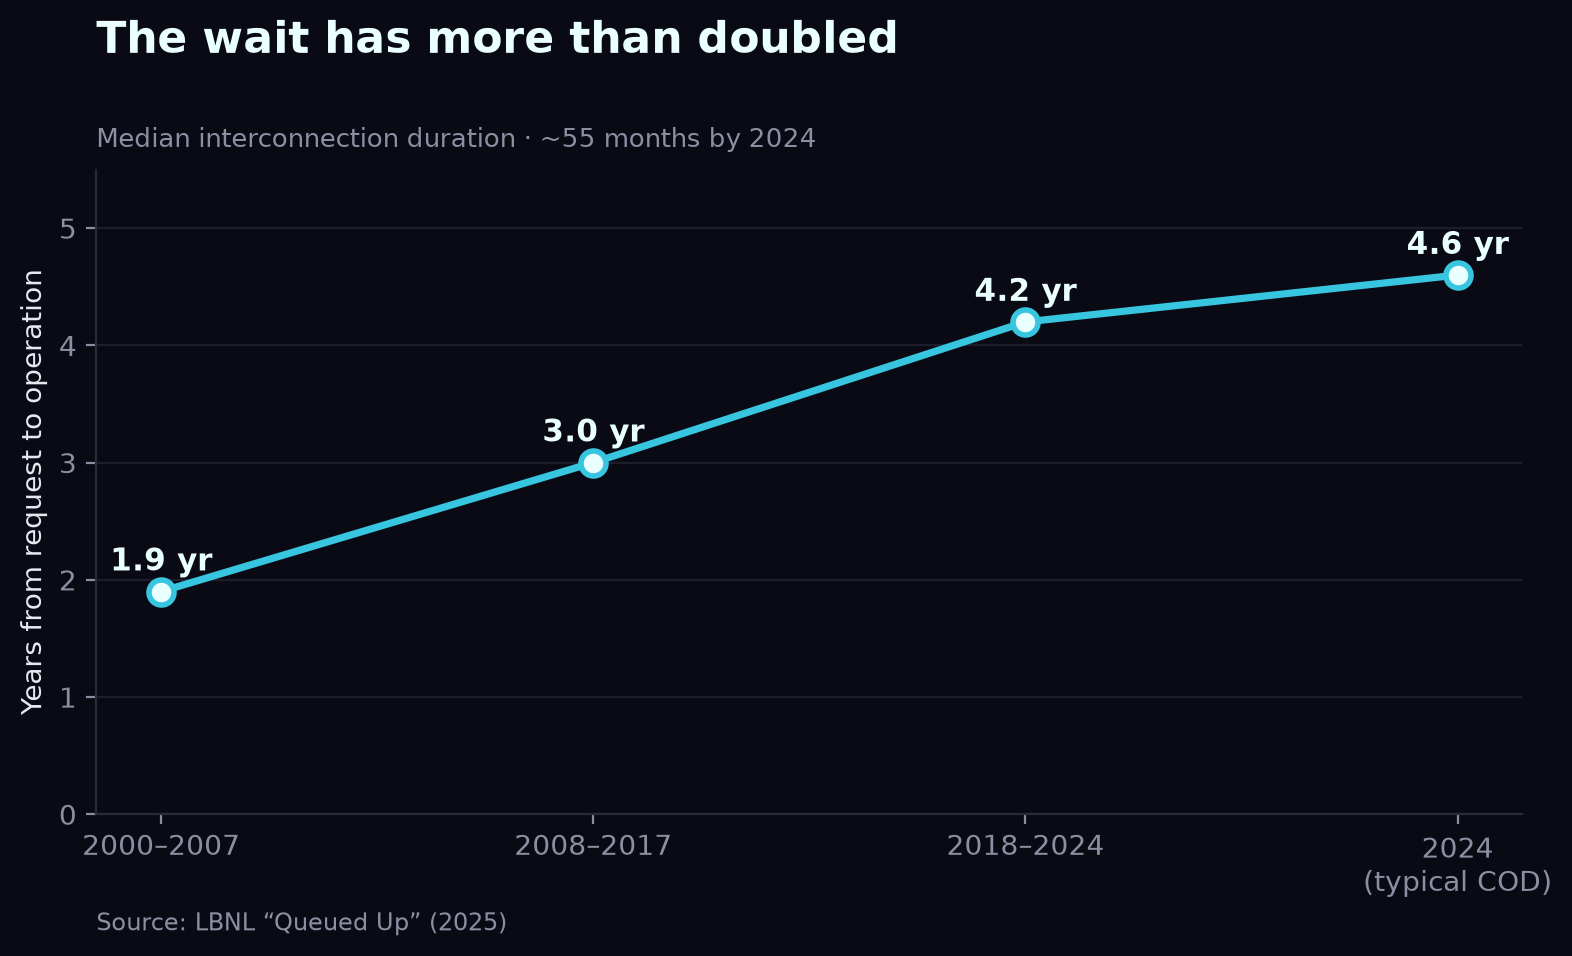
Why so little gets through? The wait. Nationally, the median time from interconnection request to commercial operation has more than doubled — from under two years in the 2000s to about 4.5 years for projects reaching operation in 2024.
4. Supply is everywhere; demand isn't
Layering ~2,459 utility-scale power plants (≥100 MW, ~1,089 GW) under the demand picture makes the mismatch clear: generation blankets the country, but data-center load concentrates onto a handful of already-stressed grids. The problem isn't total capacity — it's location and timing.
Methodology & sources
Tools: maps and charts rendered with QGIS and Python (matplotlib) from raw public datasets. No proprietary data.
Sources:
- U.S. EIA — Energy Atlas; "Power Plants in the U.S." and transmission-line feature services (public domain)
- LBNL — 2024 U.S. Data Center Energy Usage Report; "Queued Up" 2025 Edition
- ERCOT — interconnection & load reports (via Latitude Media / Utility Dive)
- CBRE / JLL — North America Data Center reports, H2 2025
- IEA — data-centre electricity analysis, 2025
Caveat: data-center cluster locations and capacities are approximate, compiled from public market reports. Generation/transmission/queue figures are from the government/lab sources above. Current as of late 2025.
Gridlas · independent & unaffiliated · built from public data.