What's inside the full report
36 pages of maps, data, and analysis — every figure sourced.
Where AI is landing
The top 15 metros, mapped and ranked — from Northern Virginia to the inland breakout markets.
The power racing to keep up
Gas, nuclear & SMRs, solar-plus-storage — and the on-site generation boom.
The interconnection bottleneck
Queue sizes, wait times, and why "queued" is nowhere near "built."
Five regional deep-dives
Texas, Virginia, Arizona, Ohio & Georgia — each with a map, stats, and risk rating.
A 12-month outlook
Five scenarios for where the next wave of capital and capacity lands.
Companion dataset
Power plants, queues & data-center clusters as CSV / GeoJSON you can use.
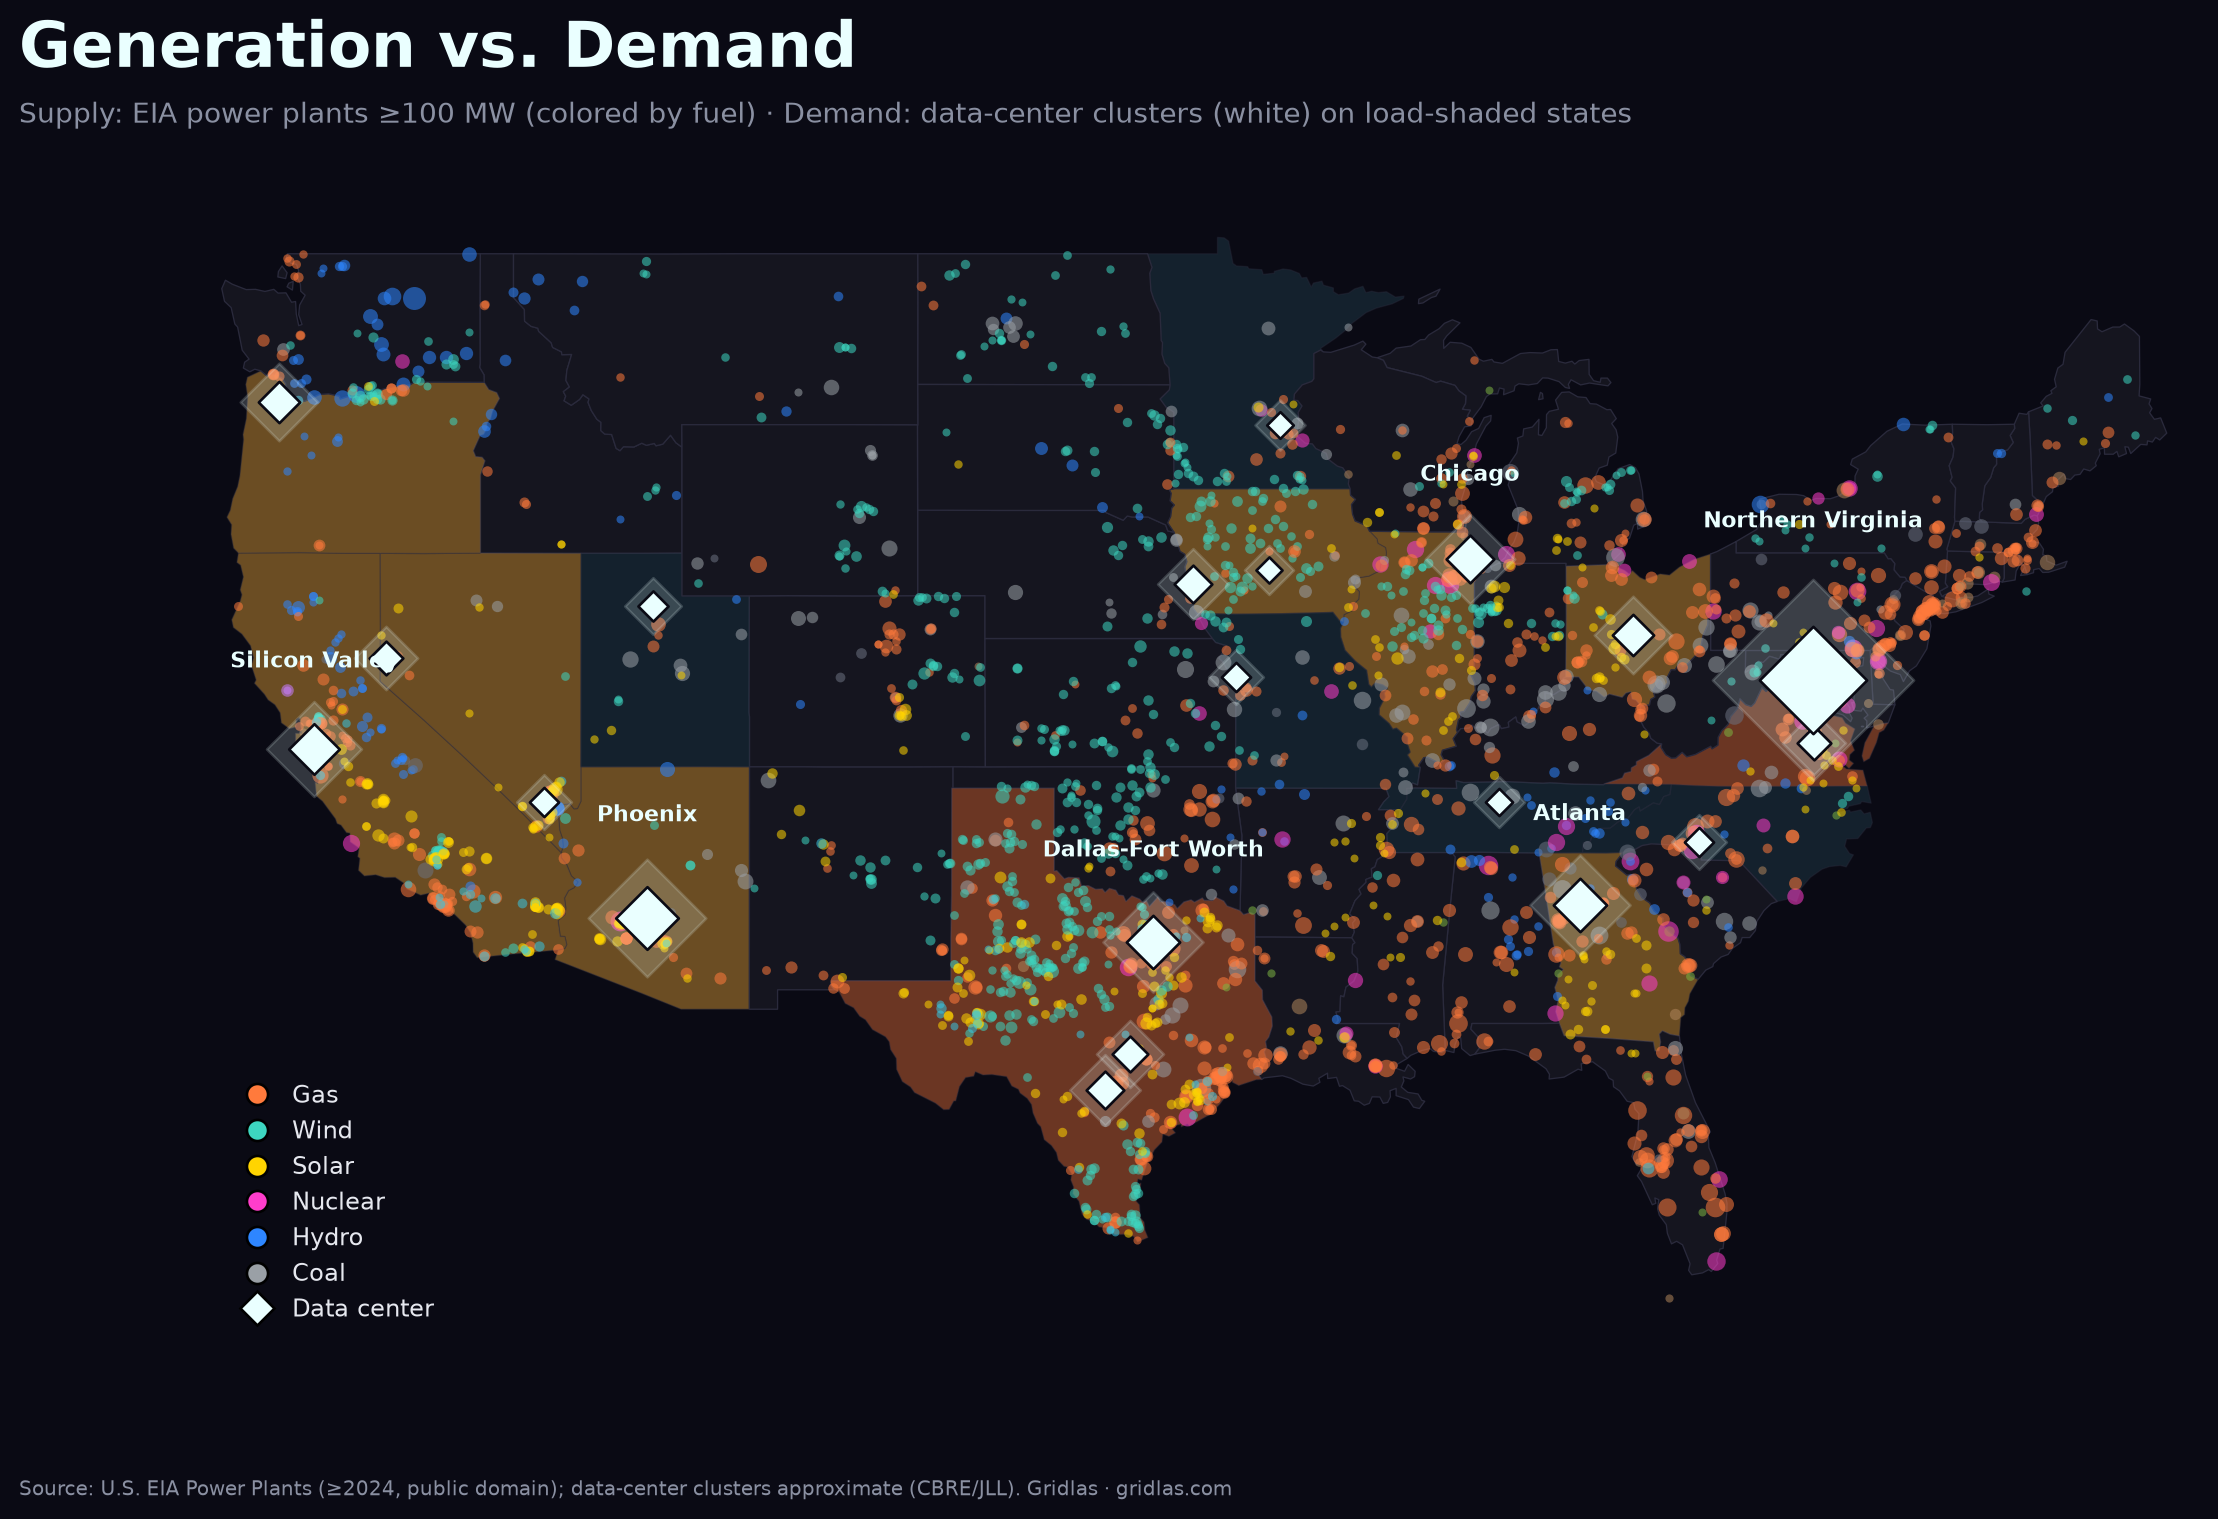
The collision, mapped
Supply is everywhere — 2,459 utility-scale plants — but demand concentrates onto specific, already-stressed grids. The full report breaks down every market, queue, and scenario.
Get the free summary →Get the full report
Instant download. Built from public data. Independent & unaffiliated.