Home / Data centers by region
Reference · U.S. EIA · LBNL · ERCOT
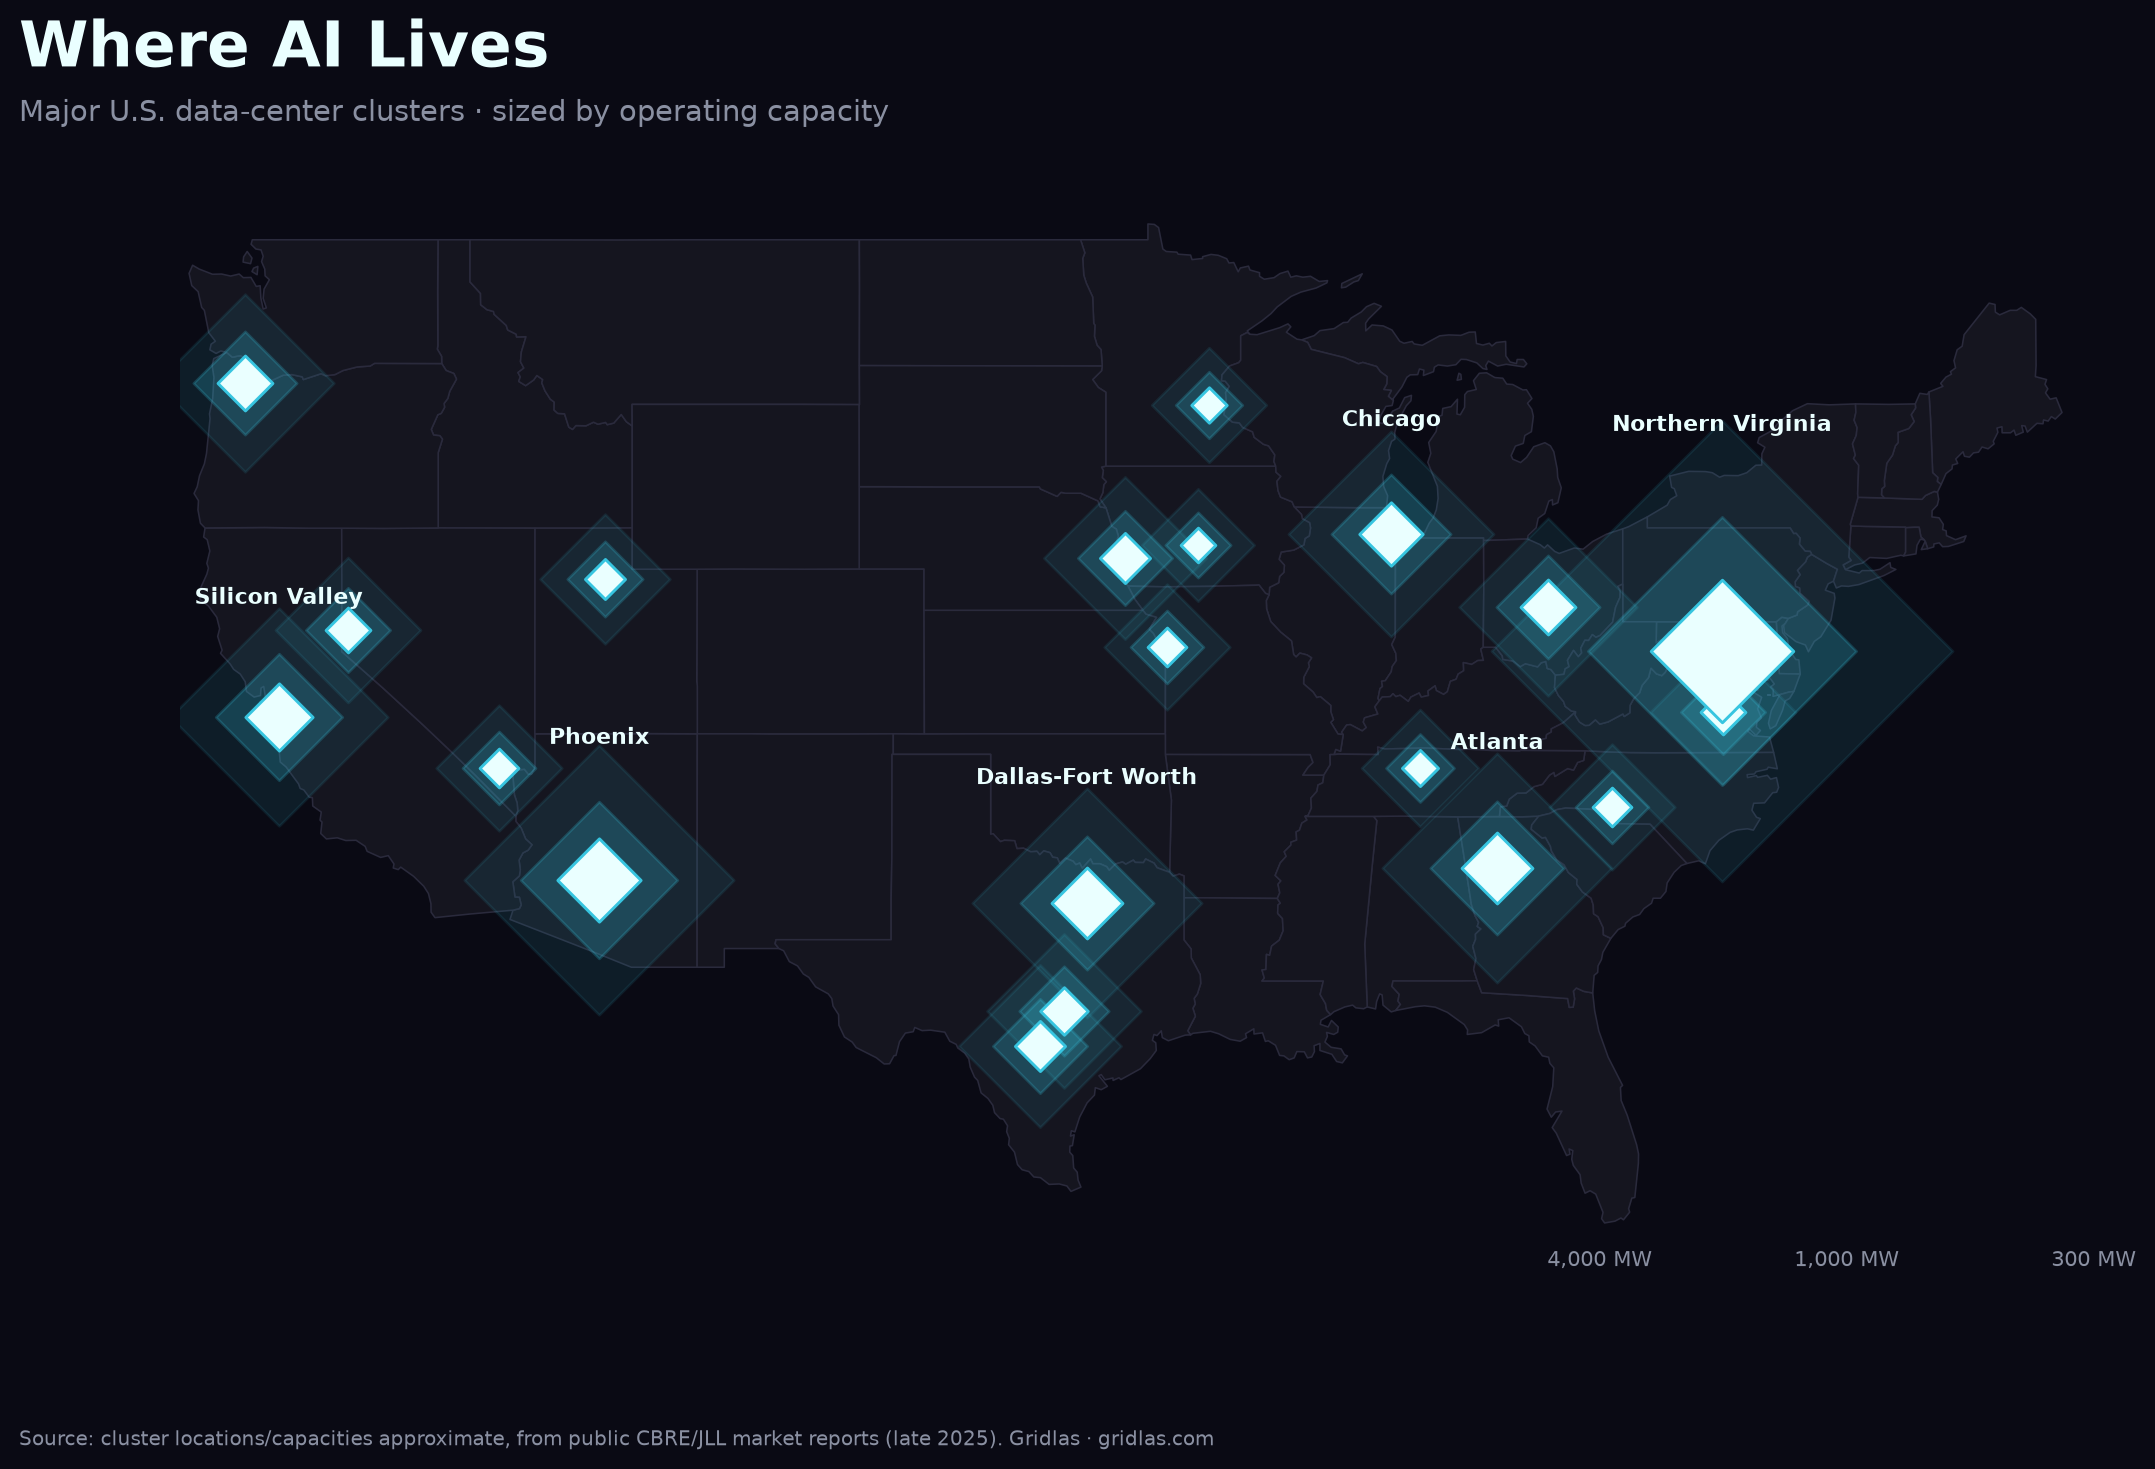
U.S. data-center power demand by state & region
AI's electricity load isn't spread evenly — it concentrates onto a handful of grids. Here's where, and why each market matters.
4.4% → 6.7–12%
DC share of U.S. power, 2023 → 2028
~226 GW
ERCOT large-load queue (Nov 2025)
~4.5 yrs
median interconnection wait
Data centers consumed 4.4% of U.S. electricity in 2023, a share LBNL projects will reach 6.7%–12% by 2028. But the national average hides the real story: the load lands on specific grids, around the clock, faster than utilities have ever had to respond. These five markets are where that collision is sharpest.
Regional deep-dives
The problem isn't total U.S. capacity — it's location and timing. Compute scales in months; power scales in years.
Want the full picture? The Gridlas report has all five regional deep-dives in depth, the ranked metro tables, high-res maps, a 12-month outlook, and the underlying dataset (CSV/GeoJSON) — built entirely from public EIA, LBNL & ERCOT data.
Get the report →
Sources: U.S. EIA (public domain); LBNL 2024 Data Center Energy Usage Report & "Queued Up" 2025; ERCOT (via Latitude Media / Utility Dive); CBRE / JLL H2 2025. See the full methodology & sources.
Gridlas · independent & unaffiliated · built from public data. · Read the full analysis →